Market Commentary, 2 March 2020
Commentary
2 March 2020
“Last week’s plunge was the worst for the stock market since 2008”
“Today’s 5% jump was the biggest one day gain since 2009”
“The yield on the Ten-year Treasury note just hit a record low of 1.09%”
With headlines like this coming from virtually any news source that you can think of, what is an investor to do? Buy stocks? Sell stocks? Buy bonds? Buy gold? Buy bitcoin?
Above all, don’t panic. While the drop last week was large, the market is only down 13% from its recent all-time highs. Remember the crash of 1987? The market was down 22.6% in a single day! The market did something similar at the end of 2018, giving up virtually all gains made during the year. I suspect that, while the declines were for different reasons, the end results will be the same; the market will be higher over time and we should be looking for opportunities.
I do not know when or at what level the market will find a bottom but eventually it will and we want to be ready. Many indicators I look at are at levels not seen since the financial crisis of 2008-2009. These extremes are not seen very often. There are also some big name stocks that are at levels not seen for 20 years, again extremes not seen that often. Indiscriminate selling has been the order of the day. Today’s 5% rally was a step in the right direction but it was on lower volume that the big drops last week. I would like to see up days on higher volume to be assured the big money is buying back into this market.
The panic will subside eventually. This doesn’t mean that we won’t see lower prices in the short run but some things are starting to appear on the “bargain shelf”.
Mark Twain was said to observe, “History does not repeat, but it does rhyme.” Hopefully that is what we will witness as we go forward.
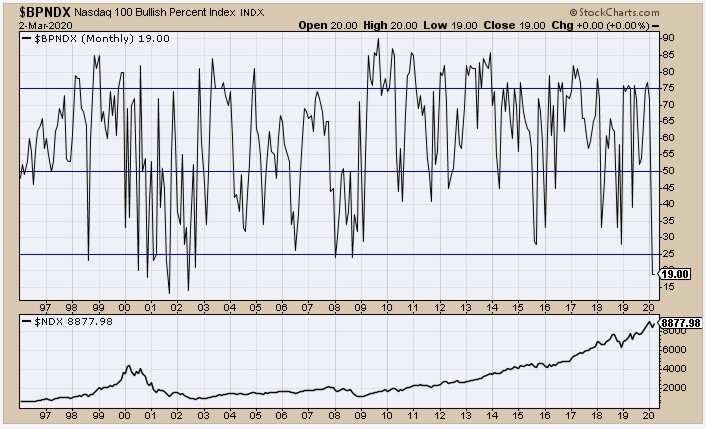
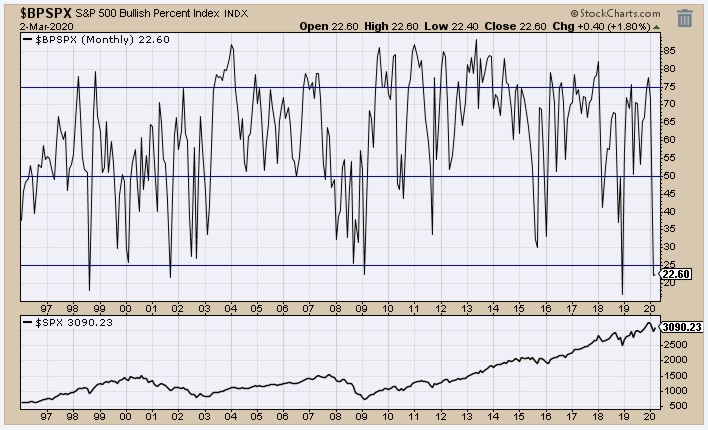
Below are some charts that depict the extremes I mentioned.
The chart above is the percentage of stocks in the Nasdaq 100 Index that are on Point &Figure buy signals. As you can see, it is currently lower that it was during the financial crisis!
The chart is the percentage of stocks in the S&P 500 Index that are on Point & Figure buy signals. Again, lower than the level hit in the financial crisis.


